privatewelldata / States / Minnesota / Arsenic
Arsenic in well water in Minnesota
19% of 5,914 sampled wells in Minnesota had arsenic above the EPA limit of 10 µg/L (latest result per well, 75 counties, samples 1972–2025). The highest county share was Grant County: 93% of 14 wells. Data updated 2026-10-18.
of sampled wells above 10 µg/L
wells with a result
counties with data
counties where 1 in 4+ wells were above
Arsenic in wells usually comes from the rock and sediment the water passes through, so it can vary a lot between neighbouring wells. You cannot see, smell or taste it; only a lab test shows it. Federal limits apply to public water systems; a private well is the owner's responsibility to test (EPA).
% of sampled wells above the EPA limit (latest result per well; counties with 10+ wells). Source: USGS/EPA Water Quality Portal, 2026-10-18 · privatewelldata.com
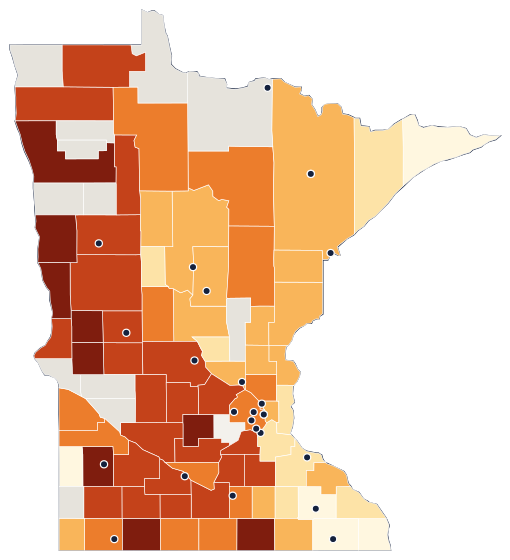
Arsenic by county in Minnesota
| County | Above 10 µg/L | Median | 90th pct. | Years |
|---|---|---|---|---|
| Grant County | 93% of 14 | 26.8 µg/L | 41.3 | 1993–2006 |
| Stevens County | 76% of 17 | 29 µg/L | 58.8 | 1994–2006 |
| Jackson County | 67% of 15 | 25.6 µg/L | 49.97 | 1993–2020 |
| Freeborn County | 60% of 10 | 10.7 µg/L | 18 | 1993–2015 |
| McLeod County | 56% of 79 | 12.5 µg/L | 28.8 | 1994–2011 |
| Clay County | 51% of 100 | 10.585 µg/L | 49 | 1993–2025 |
| Polk County | 50% of 18 | 10.405 µg/L | 22.6 | 1991–2024 |
| Lyon County | 50% of 10 | 12.845 µg/L | 51.5 | 1979–2025 |
| Wilkin County | 50% of 10 | 8.065 µg/L | 33.04 | 1993–1995 |
| Pope County | 48% of 84 | 8.13 µg/L | 39.7 | 1985–2004 |
| Meeker County | 46% of 94 | 6.94 µg/L | 25.5 | 1994–2016 |
| Rice County | 45% of 76 | 5.06 µg/L | 27.6 | 1992–2025 |
| Sibley County | 42% of 103 | 6.5 µg/L | 32 | 1993–2014 |
| Roseau County | 40% of 15 | 3.21 µg/L | 18.5 | 1995–1995 |
| Marshall County | 40% of 10 | 0.13 µg/L | 28.5 | 1991–1995 |
| Le Sueur County | 38% of 13 | 7.44 µg/L | 15.9 | 1980–1997 |
| Douglas County | 38% of 45 | 4.7 µg/L | 23.1 | 1985–2006 |
| Kandiyohi County | 38% of 101 | 4.44 µg/L | 32.68 | 1985–2020 |
| Becker County | 37% of 114 | 4.64 µg/L | 30 | 1972–2025 |
| Cottonwood County | 36% of 11 | 2.02 µg/L | 45.3 | 1979–2013 |
| Murray County | 36% of 11 | 1.48 µg/L | 55.2 | 1993–1993 |
| Wright County | 35% of 110 | 6.6 µg/L | 24.57 | 1994–2018 |
| Clearwater County | 33% of 15 | 4 µg/L | 12.8 | 1987–2025 |
| Carver County | 33% of 76 | 5.05 µg/L | 22.6 | 1994–2013 |
| Stearns County | 32% of 162 | 0.784 µg/L | 21.1 | 1973–2025 |
| Brown County | 32% of 100 | 2.42 µg/L | 26.3 | 1993–2018 |
| Redwood County | 31% of 127 | 1.37 µg/L | 24.2 | 1980–2025 |
| Otter Tail County | 31% of 229 | 2.78 µg/L | 28.5 | 1993–2025 |
| Traverse County | 31% of 13 | 4.9 µg/L | 22.12 | 1994–2013 |
| Renville County | 29% of 102 | 2.04 µg/L | 37.1 | 1993–2015 |
| Blue Earth County | 26% of 121 | 4 µg/L | 19.1 | 1980–2025 |
| Scott County | 25% of 28 | 1.12 µg/L | 21.6 | 1980–2025 |
| Watonwan County | 25% of 20 | 2.045 µg/L | 16.47 | 1980–2009 |
| Nicollet County | 25% of 106 | 3.2 µg/L | 20.3 | 1993–2014 |
| Nobles County | 23% of 78 | 0.952 µg/L | 20.5 | 1993–2022 |
| Todd County | 22% of 111 | 0 µg/L | 19.8 | 1994–2010 |
| Faribault County | 19% of 16 | 5.55 µg/L | 12.4 | 1980–2025 |
| Yellow Medicine County | 17% of 18 | 0.4 µg/L | 13.98 | 1995–2011 |
| Waseca County | 17% of 12 | 1.875 µg/L | 6.21 | 1980–2021 |
| Lac qui Parle County | 16% of 97 | 1.31 µg/L | 26.81 | 1995–2024 |
| Anoka County | 16% of 145 | 1.6 µg/L | 13.3 | 1996–2025 |
| Beltrami County | 15% of 68 | 1 µg/L | 15.1 | 1987–2025 |
| Hennepin County | 14% of 213 | 1.83 µg/L | 13 | 1979–2025 |
| Martin County | 12% of 17 | 1.9 µg/L | 9.67 | 1979–2015 |
| Aitkin County | 12% of 104 | 2.505 µg/L | 10.6 | 1995–2022 |
| Itasca County | 11% of 37 | 0 µg/L | 7.56 | 1980–2025 |
| Wabasha County | 10% of 21 | 0.14 µg/L | 2 | 1973–2025 |
| Pine County | 9% of 74 | 1.165 µg/L | 5.84 | 1995–2025 |
| Cass County | 9% of 129 | 1.17 µg/L | 9.94 | 1987–2025 |
| Carlton County | 9% of 130 | 2.455 µg/L | 8.25 | 1980–2025 |
| Ramsey County | 9% of 33 | 0 µg/L | 3.21 | 1974–2025 |
| Isanti County | 9% of 111 | 1.83 µg/L | 8.5 | 1996–2018 |
| Steele County | 9% of 101 | 1.69 µg/L | 8.8 | 1980–2021 |
| Mower County | 9% of 23 | 0.9 µg/L | 3 | 1980–2025 |
| St. Louis County | 8% of 287 | 1.11 µg/L | 7.03 | 1976–2025 |
| Rock County | 8% of 53 | 0.795 µg/L | 7.6 | 1993–2021 |
| Chisago County | 6% of 96 | 0 µg/L | 5.6 | 1978–2025 |
| Crow Wing County | 6% of 136 | 0.83 µg/L | 5.84 | 1980–2025 |
| Sherburne County | 6% of 145 | 1.2 µg/L | 6 | 1974–2025 |
| Hubbard County | 6% of 109 | 0.247 µg/L | 5.02 | 1987–2025 |
| Morrison County | 5% of 129 | 1.19 µg/L | 7.54 | 1994–2025 |
| Kanabec County | 5% of 97 | 1.52 µg/L | 4.83 | 1995–2017 |
| Wadena County | 5% of 106 | 0.854 µg/L | 6.3 | 1995–2025 |
| Dakota County | 5% of 191 | 0.24 µg/L | 3.29 | 1974–2025 |
| Goodhue County | 3% of 31 | 0 µg/L | 0.53 | 1974–2025 |
| Benton County | 2% of 90 | 0.99 µg/L | 3 | 1994–2010 |
| Dodge County | 2% of 102 | 0.333 µg/L | 3.68 | 1980–2019 |
| Washington County | 2% of 164 | 0 µg/L | 2 | 1979–2025 |
| Lake County | 2% of 114 | 0.511 µg/L | 2.07 | 1976–2025 |
| Winona County | 1% of 97 | 0 µg/L | 0.433 | 1980–2024 |
| Olmsted County | 1% of 141 | 0 µg/L | 0.366 | 1990–2025 |
| Houston County | 0% of 92 | 0 µg/L | 0.225 | 1973–2016 |
| Fillmore County | 0% of 15 | 0.108 µg/L | 2 | 1977–2024 |
| Lincoln County | 0% of 12 | 0 µg/L | 2.49 | 1993–2025 |
| Cook County | 0% of 10 | 0.065 µg/L | 0.98 | 1995–1999 |
No rows match these filters. Try fewer words or clear the filters.
Download this table (CSV) · public-domain source data: Water Quality Portal (USGS, EPA, NWQMC). How we calculate these numbers.
How Minnesota compares
Share of sampled wells above the EPA arsenic limit in each state we cover (states with 100+ wells).
| # | State | Above 10 µg/L |
|---|---|---|
| 1 | Maine | 59% of 261 |
| 2 | Minnesota | 19% of 5,914 |
| 3 | Michigan | 15% of 1,077 |
| 4 | Ohio | 15% of 620 |
| 5 | New Hampshire | 14% of 863 |
| 6 | California | 14% of 8,314 |
| 7 | Massachusetts | 8% of 474 |
| 8 | Pennsylvania | 4% of 3,072 |
| 9 | North Carolina | 4% of 340 |
| 10 | Wisconsin | 3% of 610 |
| 11 | New Jersey | 2% of 2,227 |
| 12 | New York | 2% of 3,544 |
| 13 | Virginia | 1% of 298 |
Where to test: official lab list for Minnesota
About this data
- Each well counts once, using its latest arsenic result in the Water Quality Portal (siteType = Well), downloaded 2026-10-18.
- Results reported as "not detected" count as below the limit. Results far outside the plausible range are withheld for review, not shown.
- Sampled wells include monitoring and research wells, not only household wells, and are not a random sample, so the share is a guide to local risk, not a rate for all homes.
- The limit is the EPA maximum contaminant level for public water systems (EPA).
Questions
Is arsenic common in Minnesota well water?
In our data, 1,101 of 5,914 sampled wells in Minnesota (19%) had a latest arsenic result above the EPA limit of 10 µg/L, across 75 counties. That ranks Minnesota 2 of 13 states we cover for this share.
Which Minnesota counties have the most wells above the arsenic limit?
Among counties with at least 10 sampled wells: Grant County (93%, 13 of 14 wells); Stevens County (76%, 13 of 17 wells); Jackson County (67%, 10 of 15 wells).
Does this tell me whether my well is safe?
No. These are past results from wells sampled by USGS, EPA and state programs, including monitoring wells, and levels differ from well to well. The only way to know your water is to test your own well at a certified lab.
How do I test my well for arsenic in Minnesota?
Order a arsenic test from a lab on Minnesota's official certified-lab list (linked on this page) and ask for its bottles and sampling instructions. Our test helper suggests what else to test for at the same time.
What should I do if my arsenic result is above 10 µg/L?
Retest to confirm, use another water source for drinking and cooking while you sort it out, and look at certified treatment options. Our guide walks through each step with sources.