privatewelldata / States / California / Arsenic
Arsenic in well water in California
14% of 8,314 sampled wells in California had arsenic above the EPA limit of 10 µg/L (latest result per well, 51 counties, samples 1925–2026). The highest county share was Mono County: 57% of 63 wells. Data updated 2026-10-18.
of sampled wells above 10 µg/L
wells with a result
counties with data
counties where 1 in 4+ wells were above
Arsenic in wells usually comes from the rock and sediment the water passes through, so it can vary a lot between neighbouring wells. You cannot see, smell or taste it; only a lab test shows it. Federal limits apply to public water systems; a private well is the owner's responsibility to test (EPA).
% of sampled wells above the EPA limit (latest result per well; counties with 10+ wells). Source: USGS/EPA Water Quality Portal, 2026-10-18 · privatewelldata.com
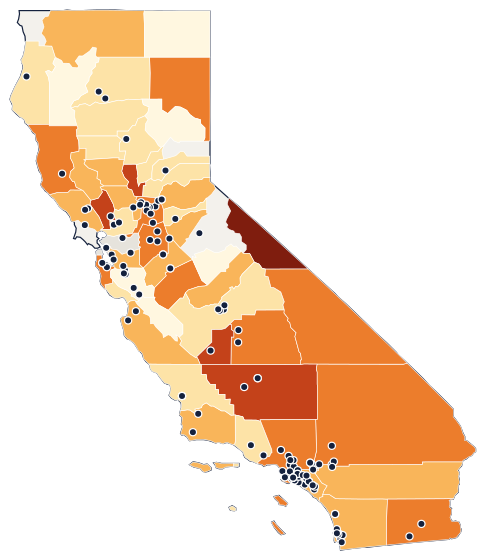
Arsenic by county in California
| County | Above 10 µg/L | Median | 90th pct. | Years |
|---|---|---|---|---|
| Mono County | 57% of 63 | 22 µg/L | 537 | 1973–2022 |
| Kings County | 36% of 149 | 7 µg/L | 56 | 1984–2021 |
| Sutter County | 32% of 94 | 7.65 µg/L | 22 | 1967–2022 |
| Kern County | 29% of 505 | 4 µg/L | 42 | 1964–2023 |
| Napa County | 25% of 55 | 3.9 µg/L | 35 | 2001–2022 |
| San Bernardino County | 25% of 1,441 | 2.9 µg/L | 34 | 1951–2023 |
| Imperial County | 20% of 81 | 3.4 µg/L | 40 | 1958–2023 |
| Sacramento County | 19% of 234 | 3.3 µg/L | 20 | 1958–2022 |
| Tulare County | 19% of 182 | 2.3 µg/L | 46 | 1986–2023 |
| San Joaquin County | 19% of 302 | 3.3 µg/L | 19 | 1970–2023 |
| Inyo County | 17% of 87 | 2.2 µg/L | 19.1 | 1945–2024 |
| San Mateo County | 17% of 12 | 1.005 µg/L | 7.6 | 2007–2022 |
| Los Angeles County | 13% of 597 | 1.5 µg/L | 14.7 | 1964–2023 |
| Mendocino County | 13% of 71 | 0.13 µg/L | 17 | 1982–2025 |
| Merced County | 12% of 236 | 3 µg/L | 12 | 1925–2023 |
| Lassen County | 12% of 42 | 2.3 µg/L | 9.9 | 1980–2024 |
| Riverside County | 9% of 546 | 1 µg/L | 9 | 1963–2026 |
| Madera County | 8% of 118 | 2 µg/L | 8 | 1987–2023 |
| San Diego County | 8% of 279 | 1 µg/L | 9.4 | 1964–2022 |
| Sonoma County | 8% of 123 | 1.6 µg/L | 9 | 1976–2022 |
| Colusa County | 8% of 136 | 2.05 µg/L | 10 | 1960–2021 |
| Alameda County | 8% of 88 | 1 µg/L | 7 | 1974–2022 |
| Orange County | 8% of 66 | 1.8 µg/L | 5.4 | 1999–2020 |
| Siskiyou County | 7% of 29 | 0.29 µg/L | 3.9 | 2003–2020 |
| Calaveras County | 7% of 15 | 1.8 µg/L | 9 | 2005–2021 |
| Lake County | 7% of 15 | 0.11 µg/L | 3.5 | 2009–2025 |
| Santa Barbara County | 7% of 226 | 0.865 µg/L | 8.1 | 1958–2021 |
| Yolo County | 6% of 136 | 3 µg/L | 8 | 1970–2021 |
| Monterey County | 6% of 290 | 1.5 µg/L | 8 | 1971–2023 |
| El Dorado County | 6% of 86 | 0.575 µg/L | 5 | 1990–2022 |
| Stanislaus County | 5% of 238 | 3.5 µg/L | 9.7 | 1966–2021 |
| Nevada County | 5% of 62 | 0.405 µg/L | 5.3 | 2007–2022 |
| Amador County | 5% of 21 | 0.75 µg/L | 3.3 | 2008–2022 |
| Placer County | 5% of 110 | 1.35 µg/L | 6 | 1970–2022 |
| Humboldt County | 5% of 22 | 0.21 µg/L | 3.6 | 2009–2020 |
| Solano County | 4% of 48 | 3 µg/L | 7 | 1974–2022 |
| Fresno County | 4% of 556 | 2 µg/L | 6 | 1979–2023 |
| Glenn County | 3% of 88 | 2 µg/L | 6 | 1960–2021 |
| Butte County | 3% of 130 | 1 µg/L | 6.9 | 1959–2021 |
| Shasta County | 3% of 99 | 0.89 µg/L | 2.2 | 1979–2022 |
| Tehama County | 3% of 144 | 1 µg/L | 3.9 | 1959–2022 |
| Santa Cruz County | 2% of 115 | 1 µg/L | 3 | 1971–2023 |
| San Luis Obispo County | 2% of 59 | 1 µg/L | 5.3 | 1980–2023 |
| Yuba County | 2% of 59 | 1 µg/L | 5 | 1970–2021 |
| Ventura County | 1% of 76 | 0.595 µg/L | 2.3 | 1978–2022 |
| Santa Clara County | 0% of 82 | 0.49 µg/L | 2 | 1980–2022 |
| Mariposa County | 0% of 32 | 0 µg/L | 6 | 1991–2008 |
| San Benito County | 0% of 30 | 1.3 µg/L | 7.7 | 2008–2022 |
| Modoc County | 0% of 17 | 0.35 µg/L | 4 | 2003–2024 |
| Trinity County | 0% of 12 | 0.145 µg/L | 0.74 | 2010–2015 |
| Plumas County | 0% of 10 | 0.325 µg/L | 2 | 2008–2020 |
No rows match these filters. Try fewer words or clear the filters.
Download this table (CSV) · public-domain source data: Water Quality Portal (USGS, EPA, NWQMC). How we calculate these numbers.
How California compares
Share of sampled wells above the EPA arsenic limit in each state we cover (states with 100+ wells).
| # | State | Above 10 µg/L |
|---|---|---|
| 1 | Maine | 59% of 261 |
| 2 | Minnesota | 19% of 5,914 |
| 3 | Michigan | 15% of 1,077 |
| 4 | Ohio | 15% of 620 |
| 5 | New Hampshire | 14% of 863 |
| 6 | California | 14% of 8,314 |
| 7 | Massachusetts | 8% of 474 |
| 8 | Pennsylvania | 4% of 3,072 |
| 9 | North Carolina | 4% of 340 |
| 10 | Wisconsin | 3% of 610 |
| 11 | New Jersey | 2% of 2,227 |
| 12 | New York | 2% of 3,544 |
| 13 | Virginia | 1% of 298 |
Where to test: official lab list for California
About this data
- Each well counts once, using its latest arsenic result in the Water Quality Portal (siteType = Well), downloaded 2026-10-18.
- Results reported as "not detected" count as below the limit. Results far outside the plausible range are withheld for review, not shown.
- Sampled wells include monitoring and research wells, not only household wells, and are not a random sample, so the share is a guide to local risk, not a rate for all homes.
- The limit is the EPA maximum contaminant level for public water systems (EPA).
Questions
Is arsenic common in California well water?
In our data, 1,160 of 8,314 sampled wells in California (14%) had a latest arsenic result above the EPA limit of 10 µg/L, across 51 counties. That ranks California 6 of 13 states we cover for this share.
Which California counties have the most wells above the arsenic limit?
Among counties with at least 10 sampled wells: Mono County (57%, 36 of 63 wells); Kings County (36%, 54 of 149 wells); Sutter County (32%, 30 of 94 wells).
Does this tell me whether my well is safe?
No. These are past results from wells sampled by USGS, EPA and state programs, including monitoring wells, and levels differ from well to well. The only way to know your water is to test your own well at a certified lab.
How do I test my well for arsenic in California?
Order a arsenic test from a lab on California's official certified-lab list (linked on this page) and ask for its bottles and sampling instructions. Our test helper suggests what else to test for at the same time.
What should I do if my arsenic result is above 10 µg/L?
Retest to confirm, use another water source for drinking and cooking while you sort it out, and look at certified treatment options. Our guide walks through each step with sources.